VAWA
The home of amateur winemaking in Vancouver
Titration for Tartaric and Malic Acids
October 10, 2005
At the Second International Cool Climate Viticulture and Oenology Symposium held in Aukland, New Zealand, in January 1988, a paper was presented titled A rapid, simple method for the estimation of malate and tartrate in grape juice. The presenters were Kerry M. Norton, graduate student, and David A. Heatherbell, Associate Professor, Department of Food Science and Technology, Oregon State University.
I was interested in seeing if I could use their process to identify the tartrate/malate composition of juice from British Columbia grapes, since malic acid tends to be the dominant acid in many musts. It also helped me understand better the anomalies of, for example, high pH and high acid. With help from Gary Strachan and Dr. Andy Reynolds of the Summerland Research Station (now the Pacific Agricultural Research Centre), I was able to do the experiment successfully. Charles Plant provided accurate pH 2.70 – 3.00 and pH 4.50 – 4.80 graphs, which helped improve the accuracy of my tests.
In order to verify my results, Dr. Reynolds did the same analysis of the juice I used in high performance color chromatography equipment at the research centre. The results were very close, close enough to encourage me to continue the tests, which I did for four years beginning in 1992.
It became apparent to me that it was more an academic exercise than a practical one; but it was very interesting and did give me some insights into the acid balance in the grapes I used. It is also time-consuming. On the odd occasion when the pH was very low and the TA very high in Cabernet Sauvignon, I was able to make an educated guess as to how much tartaric acid I would have to add in order to have a decent balance when the wine had finished its malolactic fermentation. In short, I was able to make more educated estimates of the way my wines would turn out.
One phenomenon I encountered was that the sum of the two acids was always greater than the TA. The reason I believe is that below pH 2.70 all the tartrate is still in its bound state and all the malate above 4.50 is totally in its free state, thus both acids are susceptible to total neutralization without interference from each other. In the Abstract of the presentation it was explained out that: “Winemakers currently use pH and titratable acidity to help determine the suitability of wine grapes for harvest because they provide and approximation of the pH and TA of the finished wine. In grape musts, pH and TA are principally affected by the amounts and proportions of malic and tartaric acids, which together constitute at least 90% of the total acids, and by potassium, which accounts for most of the salt formation. It is not possible to determine malate, tartrate and potassium concentrations in must from pH and TA values alone, because different combinations of the three constituents may cause similar pH and TA.”
The process is not for everybody; indeed, it is probably not important for most to even consider, but it could be an interesting challenge for the inquisitive few.
Materials Needed and Procedures for Titration for Tartaric & Malic Acids
Equipment:
- pH meter capable of 0.01 accuracy
- magnetic stirrer if available but not necessary
- Pipette or syringe (the pipette will be easier to control the titrations)
Reagents:
- 0.1 normal sodium hydroxide (NaOH)
- 6 normal hydrochloric acid (HCL)
- 8 normal potassium hydroxide (KOH)
Buffers:
- pH 2 and pH 7
Graphs:
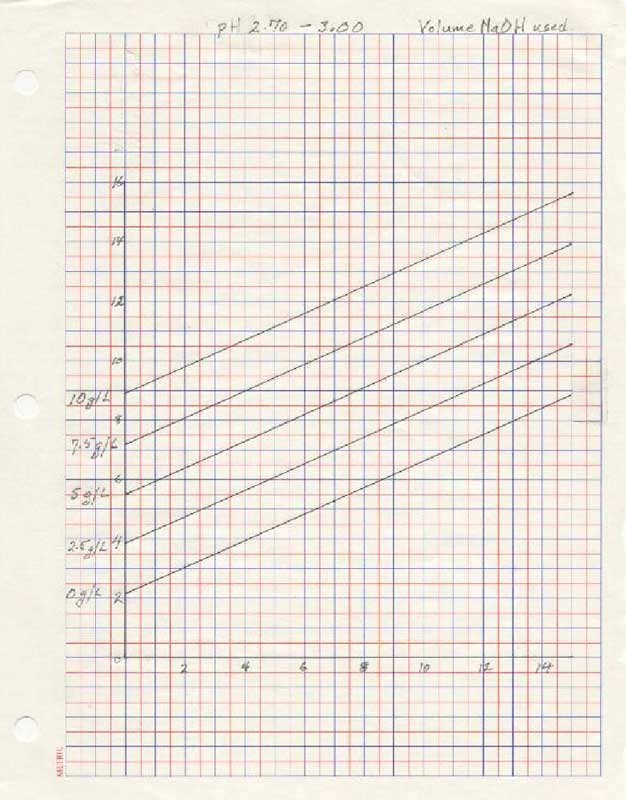
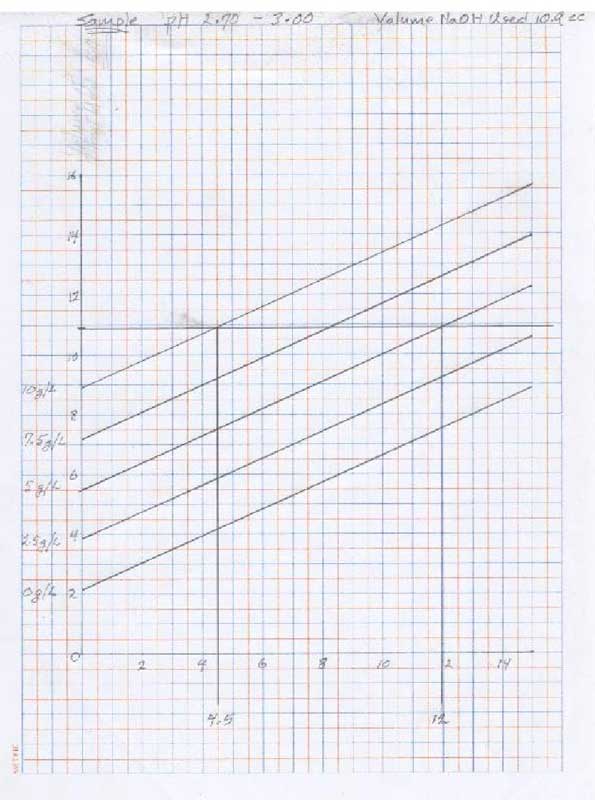
- for pH 2.70 - 3.00:
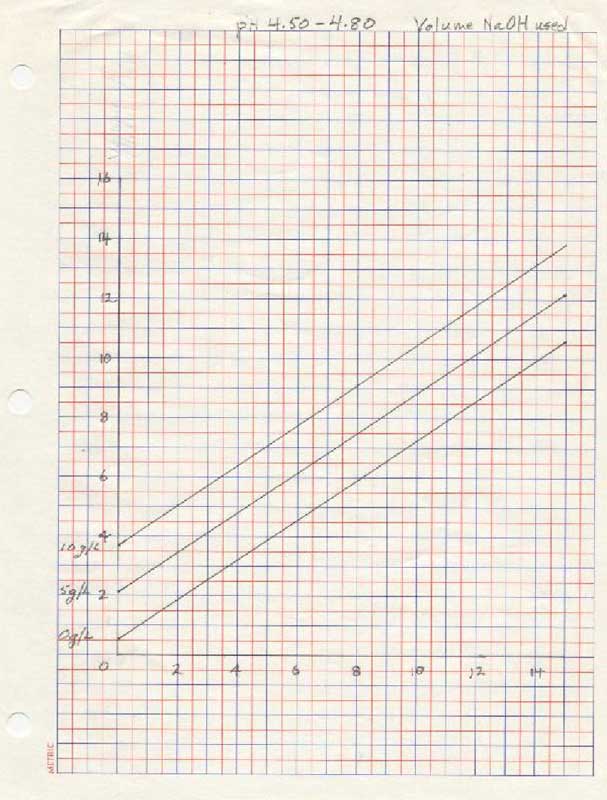
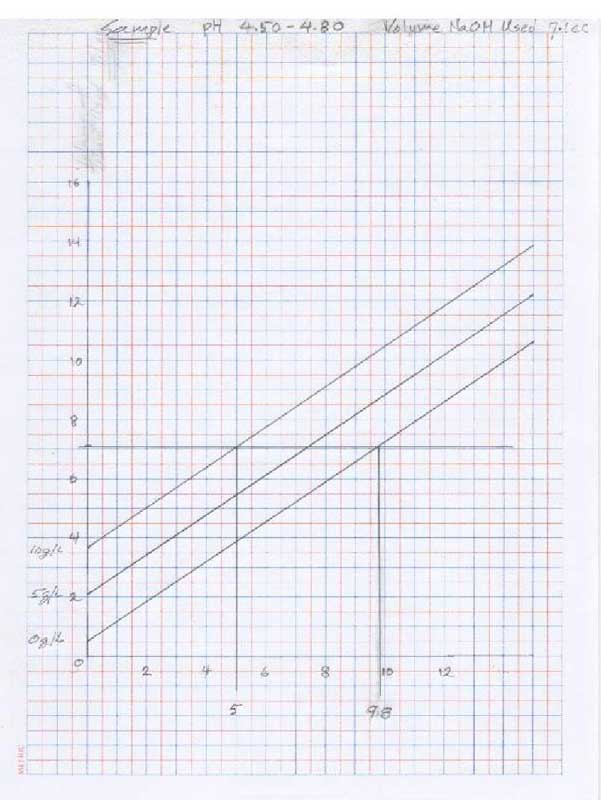
- for pH 4.5 - 4.80:
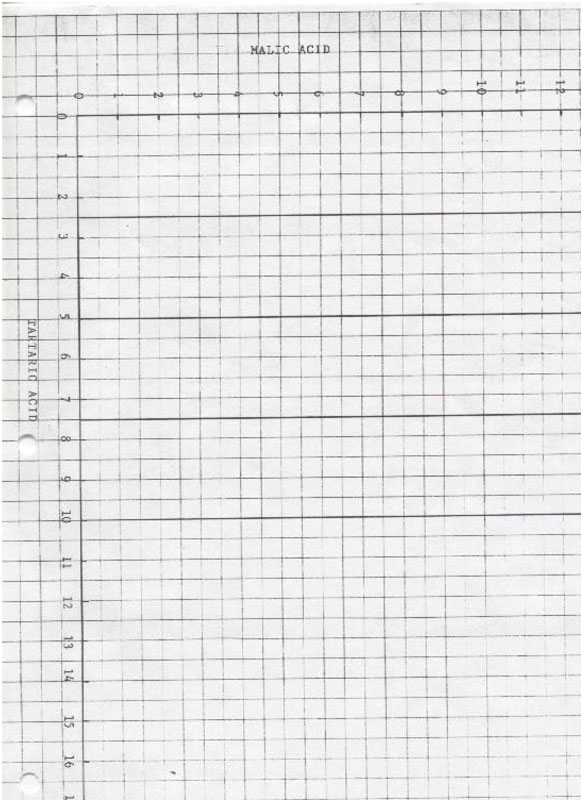
- for plotting tartaric and malic acid levels from the above graphs:
Procedure:
- Obtain a juice sample which has not precipitated any tartrates and is at room temperature.
- Standardize the pH meter at room temperature to pH 2 and pH 7
- Put 50 ml of clear juice into a beaker and, using 6 normal HCL, lower the pH to just below pH 2.70. Using the NaOH raise the pH to exactly 2.70, record the starting point in your pipette or syringe and titrate to exactly pH 3.00. Record the volume of titrant used.
- Put 50 ml of clear juice into a beaker and, using the KOH, raise the pH to just below 4.50. Using the NaOH, raise the pH to exactly 4.50, record the starting point and titrate to exactly ph 4.80. Record the volume of titrant used.
- Using the volume of titrant used in step 3, locate the number on the vertical axis of the graph pH 2.70 – 3.00 and draw a horizontal line. Locate at least two points where the horizontal line intersects the curves and draw vertical line to the horizontal axis.
- Using the volume of titrant used in step 4, locate the number on the vertical axis and draw a horizontal line. Locate at least two points where the horizontal line intersects the curves and draw vertical lines to the horizontal axis.
- Using the graph – tartaric and malic acid, transfer the two numbers from the horizontal axis from the chart pH 2.70 – 3.00 to the vertical axes which correspond with the curves from which these numbers were derived: ie – if the lines intersected on the 10g/l and the 2.5g/l, locate those points on the corresponding vertical axes of the graph and draw a line between the point of intersection.
- Repeat the above process using the numbers obtained from the ph 4.50 – 4.80 graph.
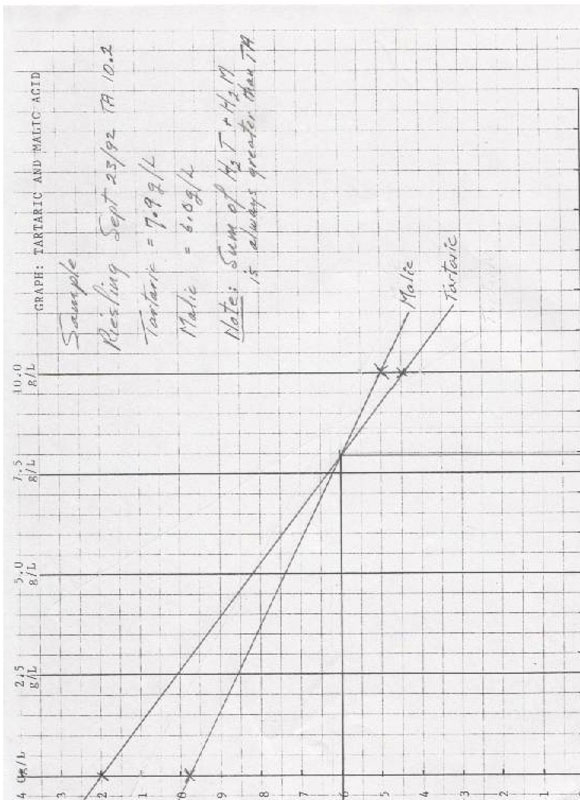
- Where the two lines intersect, draw a horizontal line to the malic axis and a vertical line to the tartaric axis. They will give an estimate of the volumes of malic and tartaric acids in the juice.
Sample Graphs:
- for pH 2.70 - 3.00:
- for pH 4.5 - 4.80:
- for plotting tartaric and malic acid levels from the above graphs: